2014年8月23日 星期六

SolarCity、SunPower、First Solar 相續投入家庭太陽能發電,將大幅降低尖峰用電量及發展出分散式太陽能發電產業 ( SolarCity, SunPower, First Solar with continued investment in home solar power, will significantly reduce peak electricity consumption and develop a distributed solar power industry )

SolarCity 公布第二季財報,太陽能板裝設遽增 216%

美國太陽能租賃龍頭 SolarCity 於 8 月 7 日公布 2014 年第二季財報,已裝設的太陽能板總發電量在第二季提升到 218 MW,遽增 216%,且光第二季單季就增加了 3 萬名客戶。

2012 年第一季時,SolarCity 裝設一組太陽能發電系統平均每瓦成本為 3. 16 美元,2014 年第一季已大幅跌落至 2.46 美元,第二季只剩 2.29 美元,成本下跌速度相當快,營運長 Tanguy Serra 更表示,成本降低速度為預期目標的兩倍之多。

此外,SolarCity 最近剛併購高效太陽能電池與模組製造商 Silevo,有了自己的完整產業鏈,將更能有效降低成本,因此 SolarCity 大膽預估 2017 年將達成每瓦 1.9 美元的低安裝成本。

至於SolarCity 即將發行的第三次資產債券,金額將提升至 2 億 100 萬美元,標準普爾(S&P)信用評級則為BBB+。儘管第二季太陽能板安裝量暴增,但 SolarCity 保守預估第三季安裝量會稍微下滑在 135 到 150 MW 間;2014 年整年安裝量約為 500 到 550 MW;至於 2015 年,則樂觀預估會達到 900 至 1,000 MW。

SolarCity 目前太陽能板安裝數量的成長與需求已遠遠超乎預期,持續穩座太陽能租賃龍頭。SolarCity 樂觀預估在接下來 20 年內,公司營收可望超過 33 億美元。

SolarCity Downgraded On Escalating Stock, Competition

SolarCity got a downgrade Tuesday because of its escalating stock price and the increasing competition from rivals, including a company expected to launch an initial public offering soon. That's the assessment from Ben Kallo, an analyst for Robert W. Baird, in a research report released Tuesday. He cut his rating on SolarCity (NASDAQ:SCTY) stock to neutral from outperform, but he kept his 83 price target.

SolarCity stock was down 2.5% in early afternoon trading in the stock market today, near 70.25. But SolarCity stock is up 24% for the year.

In his report, Kallo said that although SolarCity is the leader in the accelerating U.S. residential market for solar products, the company's stock price might have gotten a bit ahead of itself. And he cites rising competition with SunPower (NASDAQ:SPWR), First Solar (NASDAQ:FSLR) and Vivint, which is reportedly working on an IPO. SolarCity recently announced plans to manufacture its own solar panels.

"We believe SolarCity's move into high-efficiency panel manufacturing introduces scale-up risk ... . SunPower has over a decade of experience in manufacturing high-efficiency solar panels and has allocated 2.5-plus years to construct and ramp its Fab 4 (about 350 megawatt) manufacturing line," he wrote. "Although SolarCity has considerable future earnings and cash-flow generation capabilities, we believe SunPower and First Solar are currently best positioned, given their manufacturing capabilities, international presence and positive earnings." SolarCity this month reported rising losses and lower-than-expected Q2 revenue.

DE Penetration Lowers the Value of Traditional Generation ( 美國分散式太陽能成長讓傳統發電廠價值下降 )

As DE proliferates, traditional generation assets are likely to decline in value. Parallels with the German market—in which the total share of generation represented by nuclear and fossil-fuel-based sources is expected to fall from a level of 83 percent in 2010 to 30 percent by 2030—illustrate the devastating financial impact that such a drop can have on utilities. (See Is Germany Pioneering a Global Transformation of the Energy Sector?, BCG report, March 2013.) By lowering the total net load, DE reduces the market value for traditional generation. The intermittent nature of distributed generation means that the greater DE’s penetration, the greater the requirement for base-load generation to become more flexible. (The problem is compounded by utility-scale renewables, which also provide intermittent power and often receive loading preference.) In most cases, DE, combined with demand response programs and other forms of demand management, will also shave the peak off the load, cutting into the most profitable portion of the traditional generation business. These factors are influencing utilities’ decisions about whether to invest in generation or hold off and seek to optimize its residual value instead.

DE may also be a harbinger for a broader type of deconstruction that is affecting the power value chain. Integrated utilities provide bundled services: energy generation, transmission, grid services (such as power reserve and stabilization), demand response management, distribution, metering, and customer service. When a non-utility third-party cherry picks the value chain and provides specific services at a lower price, the traditional rate design no longer matches costs and revenues. New entrants have a growing stake in generation through distributed products, but they also derive benefits from services such as demand response management and energy storage. Over time, the power value chain could change dramatically.
美國分散式太陽能成長大增,讓傳統發電廠收入大幅下降,大幅降低尖峰用電量

The utilities’ business model is about investing capital and capturing returns. As DE penetration increases, capital shifts from areas that utilities have traditionally controlled to areas in which they are not involved.
solar power generation to off the peak power consumption of city

What’s more, as large investors turn their attention to the emerging DE industry, traditional utilities are beginning to lose their advantage in terms of low cost of capital. For example, we estimate that when a major solar installer and developer securitized its solar leases last year, the company’s cost of capital dropped to a level that was 200 to 300 basis points lower than most regulated utilities’ cost of capital.

With microgrid technology, DE has the potential to enable areas such as subdivisions, cities, and counties to form “islands” that either exist off the grid entirely or depend on it only for backup generation. DE could, therefore, turn the existing infrastructure of transmission lines and power plants designed to serve those areas into stranded assets.

Finally, utilities’ regulatory edge is eroding as DE companies gain leverage through regulatory management teams that represent a growing number of individual consumers. Taken as a whole, these changes are turning the odds against the traditional utility model.

蓋電廠 不如削減夏季用電尖峰

夏季炎熱,人要消暑,工廠的生產線與馬達也要通風散熱或吹冷氣以維持效率,這使得台灣的夏季出現了用電尖峰。2013 年 8 月份的用電量,就比 12 月份還要多 41 億度電。
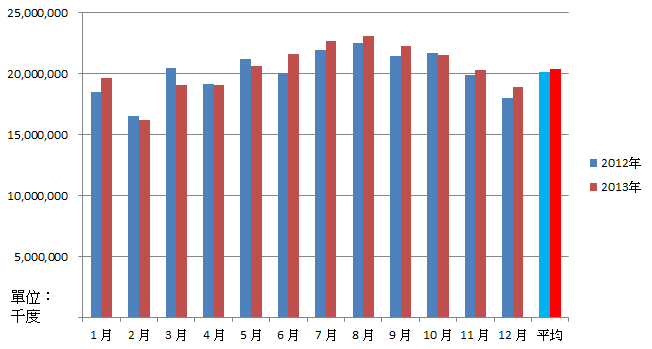
2012與2013年每月用電度數曲線。(資料出自能源局能源統計月報)

從上面這張圖,夏季每日用電曲線來看,用電尖峰是在上班日的下午 2-3 點左右,大約在 3,200 萬瓩。接著是午飯前 11 點半,第三高峰是晚間 7-8 點。到了大部分工廠停工的週日,則僅剩晚上的用電高峰,並且比上班日少了 600 萬瓩以上。造成這三個高峰的原因很多,餐飲業準備膳食、上午 11 點開始營業的大型零售業、工廠生產線作業啟動,以及民眾回家後打開照明與視聽設備。

再隨機選擇夏日與冬季各一個普通上班日來觀察。冬季上班日的用電尖峰是在下班時刻的晚上 6 點,冬季下午 2 點峰值不明顯,與夏日同一時間大約少了 7-800 萬瓩。
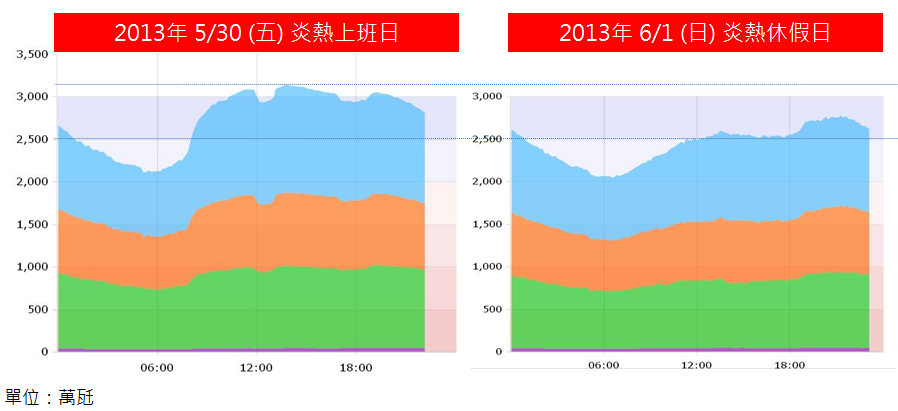
▲ 夏季上班日與周日用電曲線比較。(擷取自台電每日用電資訊)
底下這張圖則把每個月用電最多的尖峰用電量,勾勒成一年的曲線,再從 1970 年累積到 2013 年。您可以看見,台灣的用電量愈疊愈高,而夏季與非夏季間的用電差距也日趨明顯,儘管自 1989 年實施季節電價制度,但 2000 年以後仍再度明顯拉開差距。
▲ 夏季與冬季上班日用電曲線比較。(擷取自台電每日用電資訊)
台電每年會提出《台電電源開發方案》,替未來十年規劃電廠興建時程。它會依照國民所得與人口成長、國內外經濟能源趨勢等預估,去推論出長期用電負載可能的增減。值得注意的是,台電會評估每年夏季尖峰負載用電量,並在維持電力系統備用容量率 15% 的前提下去做電源開發規劃,以應付新增的用電需求以及補足退役的老舊電廠發電量。

也就因為這樣,我們為了應付夏季用電尖峰的那幾天的那幾個小時,而準備了這麼多發電廠機組。到了非夏季時,就有許多機組閒置,徒增維護經費,核電廠與大型火力電廠機組則趁著冬季輪流排歲修;雖然知道「養兵千日,用在一時」,然而「養兵」也是要錢的。

因此,只要想辦法削減「夏季尖峰負載」的用電量與時數,或至少讓它不要成長,便可以短期間內減緩台電新建電廠的壓力。爭取下來的時間與省下的電廠興建成本,則可以再拿去積極投資節電策略與發展再生能源,或強化台灣電力系統的調度能力,真正舒緩長期的用電需求。

削減「夏季尖峰負載」的方式其實有很多,有些是台電已實施您也很孰悉的手段,有些未實施的,門檻也不高,以下列舉幾個方式,希望能激發您對電力的更多想像。 ... 持續閱讀
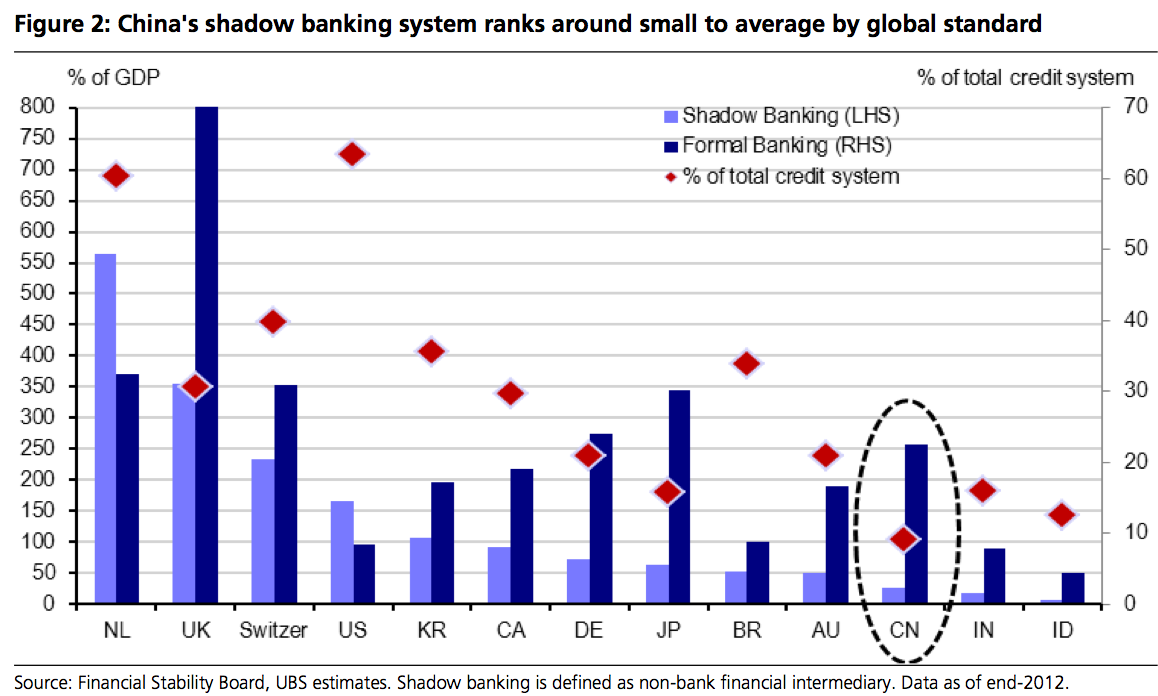
太陽能分散式發電分析
  • 由美國、澳洲太陽能分散式發電發展看,主要是
    • 政府立法鼓勵金融業提供相關類似高息商品給太陽能分散式發電公司共同以承租方式長期收取用戶費用,用戶也節約部份電費又不用買整套太陽能分散式發電系統;
    • 金融業獲得高息商品之利潤,營業上升獲利成長;
    • 用戶也節約部份電費又不用買整套太陽能分散式發電系統,同時又得到智惠型電力管理系統,隨時可以由電腦或智惠型手機了解電力狀況,房屋價值也因此升高;
    • Distributed energy (DE) technologies have grown significantly in the U.S. Last year, DE represented one of the largest investments in the utilities space, and that investment, along with consequent growth, is likely to accelerate. From 2010 to 2013, DE accounted for about 21 percent of all new capacity in the nation. The number of commercial and residential rooftop solar installations, for example, increased by 22 percent in 2013. The increase comprised about 1.9 gigawatts and represented roughly $8 billion in investments. 
  • 我國冬季用電少,夏季用電多,這是因為我國地處亞熱帶,夏日冷氣用電需求高的緣故。尖峰用電在白天,夏季白天冷氣用電需求高,因為營業公司都開冷氣及照明,用電尖峰及離峰甚致高出 48% 電力:
    • 夏季每日用電曲線來看,用電尖峰是在上班日的下午 2-3 點左右,大約在 3,200 萬瓩。
    • 夏季每日用電曲線來看,用電離峰是在上班日的早上 4-6 點左右,大約在 2,200 萬瓩。 尖峰與離峰平均差到 30% ~ 35% 電力;
    • 而太陽能發電補尖峰用電至少是最經濟又可延緩核四運轉,讓科技與時間說出該走的路,依太陽能發展的速度,一片同樣面積太陽板很快將達到 365W、每瓦 0.25 美元,一般家庭需要之白天電力很易被家庭式太陽能發電代替,因此,很容易捕台電尖峰電力不足,核能就能逐漸轉成封存備用;
    • 若LED照明及電器節能配套策略與企業強制之法令,可延緩核四運轉之年限可拉長至6年,其他能源效能也會再提高,有利於台灣做出最有利於台灣決定
    • 台灣目前最大問題就是,馬政府之國營到處漲價壓榨人民生計,真正該做的照明及電器節能配套策略根本不積極,台電對於節能策略也不夠積極,節能是一個產業
  • 目前太陽能電池效率與成本:
    • 德國有機太陽能電池效率已經到達 44.7%,如 SunPower 太陽能電池板大小可產生 717 W,每瓦可降至 0.5 美元,都市白天都將被太陽能分散式發電系統取代,將少掉 1000 萬瓩,也就是說台灣核能都可以封存,減少能源進口 GDP反而成長;
    • SunPower 太陽能電池可將21.5%的太陽能轉換成電力,太陽能電池板大小 155.9 x 104.6 cm ,可產生 345W,每瓦 0.6 ~ 0.5 美元;
    • NSP 台灣新日光太陽能電池可將15.6%的太陽能轉換成電力,每瓦 0.5 ~ 0.3 美元;
    • 大陸 Jinko 太陽能電池之太陽能轉換成電力 16.5%,每瓦 0.5 ~ 0.3 美元;
    • 預估未來幾年內, 太陽能電池將降至每瓦 0.3 ~ 0.22 美元;
    • 太陽能投資與成本計算實例投資成本最貴是儲能系統,只補尖峰用電量投資成本最低,但政府並沒有一套配套策略,以致台灣難發展成功;( 註:德國太陽能發電量已經是 23.1 GW 約總需求量之 50.5% ,但仍需足夠支儲能系統將它儲存才能完全使用,否則,仍是白天補電效益;)

2014年8月22日 星期五

中、美影子銀行創造出新經濟型態及高風險 ( China And United States create new economic shadow banking economic risk in future )

什麼是影子銀行

  影子銀行又稱為影子金融體系或者影子銀行系統(Shadow Banking system),是指銀行貸款被加工成有價證券,交易到資本市場,房地產業傳統上由銀行系統承擔的融資功能逐漸被投資所替代,屬於銀行的證券化活動。影子銀行系統的概念由美國太平洋投資管理公司執行董事麥卡利首次提出並被廣泛採用,又稱為平行銀行系統 (The Parallel Banking System),它包括投資銀行、對沖基金、貨幣市場基金、債券保險公司、結構性投資工具( SIVs )等非銀行金融機構。這些機構通常從事放款,也接受抵押,是通過杠桿操作持有大量證券、債券和複雜金融工具的金融機構。在帶來金融市場繁榮的同時,影子銀行的快速發展和高杠桿操作給整個金融體系帶來了巨大的脆弱性,併成為全球金融危機的主要推手。

  目前,影子銀行系統正在去杠桿化的過程中持續萎縮,然而,作為金融市場上的重要一環,影子銀行系統並不會就此消亡,而是逐步走出監管的真空地帶,在新的、更加嚴格的監管環境下發展。未來,對影子銀行系統的信息披露和適度的資本要求將是金融監管改進的重要內容。目前,美國已提出要求所有達到一定規模的對沖基金、私募機構和風險資本基金實行註冊,並對投資者和交易對手披露部分信息。

中國信託資產創兩年最慢增速,信託業管理的信託資產總規模為12.48萬億元人民幣

截至6月30日,信託業管理的信託資產總規模為12.48萬億元人民幣(2萬億美元),季度環比成長6.4%。隨著中國政府打擊影子銀行,投資者重新評估信託這一高殖利率投資的風險,中國信託資產創下兩年來的最慢增速。

中國信託業協會昨日在一份公告中表示,截至6月30日,信託業管理的信託資產總規模為12.48萬億元人民幣(2萬億美元),季度環比成長6.4%。 這是2012年第一季度以來的最慢增速,遠低於2008年以來的平均年增幅50%。

中國影子銀行從2010年開始出現爆炸式成長,眼下國務院總理李克強正在 努力維持經濟成長並抑制金融系統的風險。海通國際證券經濟學家胡一帆在7月25日的研究報告中指出,信託行業的「清算日」(day of reckoning)即將到來,中國信託產品本季度和下季度將迎來償付高峰期, 銀行將不得不吸收信託產品違約造成的大量損失。

中信建投駐北京分析師曾羽今天接受電話採訪時表示,監管機構、銀行和 地方政府都在努力控制信託風險,但是只有經濟提速成長,借款人重新站穩腳跟的時候,這個行業的狀況才會真正好轉。曾羽說,中國投資者變得更加厭惡風險,越來越來的投資者將選擇殖利率較低、風險較低的產品。
中國大陸總負債 2012 達到GDP 277%, 到達 2014 就會超越德國, 預估到 2016 極可能與義大利一樣成為高負債國 

6月末,信託業管理的信託資產總規模比5月末下降2400億元。公告稱這是首次出現月度負成長。中國信託業協會表示,第二季度信託產品的平均殖利率從第一季度的6.44%升至6.87%。

收緊政策

中國1月份避免了首例信託產品違約,當時中誠信託發行的30億元高殖利率產品到期前幾天,購買這款產品的投資者得到兌付。該公司上個月推遲了對另一款產品的償付。

從煤礦企業到房地產開發商的借款人出現兌付困難後,中國銀監會4月份收緊了對新信託產品的規定。李克強希望通過增加銀行貸款、抑制成本更高的影子融資來降低企業的借貸成本,進而扶持企業發展,支持經濟成長。

公告顯示,截止2014年6月末存續的12.48萬億元信託資產中,來源於各類金融機構自有資金的投資占比35.26%;來源於以各類金融機構為主體的理財資金的投資占比33.89%;剩余的來自最低投資額為100萬的普通合格投資者。

房地產風險

曾羽說,上半年很多產品出現問題,監管機構對風險發出預警之後,信託公司承受著改善風險控制的壓力,因此他們不得不放緩新產品的發行步伐。而且,過去幾年的增速根本不可持續。

中國信託業協會表示,資金信託投向工商企業和基礎產業占比約為50%, 投向房地產占比為11%。該協會表示,隨著房地產行業風險上升,資金信託投向房地產領域將更為謹慎。

該協會的報告顯示,全國68家信託公司的所有者權益總額約為2750億元, 這凸顯出它們為自己的產品承擔隱性擔保的能力有限。... 持續閱讀.

Why The Downside To The Fed's "All In" Attempt To Spike Shadow Monetary Velocity Is A $4.5 Trillion Drop In GDP

It appears that the one topic pundits have the most problems grasping is the spread between the GDP. A summary which confirms just how prevalent the confusion is, is this terrific post by the Calafia Beach Pundit, terrific not because it is even remotely correct (the post is so blatantly wrong - one wonders if Western Asset Management even expects its current and former asset managers to count beyond 2... M2 that is), but because it demonstrates how self-professed "pundits", whether of the beach variety or not, don't have the faintest grasp of more than merely trivial monetary topics.
segregation of traditional and shadow monetary aggregates, overall economic deleveraging and aggregate monetary velocity, and how all that impacts

The basis for the above-mentioned post's argument is that since M2 is growing (which it is for 16 weeks in a row now as we have been pointing out repeatedly), and since M2 velocity has performed a dead cat bounce off its 30 year lows following the complete collapse in M2 velocity after the bankruptcy of Lehman, that GDP has to grow. Period. This argument is so flawed and so one-sided, that its refutation and subsequent elaboration as to what reality truly is, is what this post was at first all about. Yet in refuting the simplistic conclusion of a mainstream pundit's myopic perspective, we uncover something far more troubling: namely that should the Fed fail in stoking consolidated aggregate monetary velocity very quickly, as the shadow liability collapse accelerates, US GDP has the potential to drop by up to $4.5 trillion over the next 3 years.

First, looking at M2, it is indeed the case that M2 has been growing. As the chart below shows, since the beginning of 2010, M2 has grown by $288.7 billion from $8485 to $8773 billion.

The problem, as Zero Hedge readers know all too well, is that M2 is merely a small subcomponent of all practical monetary aggregates, including those derived from the shadow credit system. As the beach pundit certainly should be aware, a far more important aggregate is M3, which the Fed has conveniently decided to eliminate, just so those of the permabullish persuasion can spin factless arguments using the far more easily manipulable M2 as a proxy for money demand. And looking beyond M2 is precisely where the entire argument falls flat on its face.

Since the bulk of credit and monetary growth over the past 30 years has occurred not at the observable M2 level, but at the level of shadow banking liabilities (from $620 billion in 1980 to $21.4 trillion at the peak in Q1 2008), and their monetary representation (be it M3, or our broader custom aggregation), a far more indicative view of GDP as a product of monetary aggregate velocity is that of GDP not to M2, but of GDP to M2 and Shadow Banking, which includes in addition to the generic M2 components such as M1 (currency, demand deposits), and retail money funds, savings deposits, and a variety of other deposits, also such shadow components as money market mutual funds, GSE capital, ABS issuers, repo money, open market paper, and agency and mortgage pools. The combination of all that is the most definitive and comprehensive representation of money demand available for the US economy.

The chart below shows just how much more of a factor the shadow economy has become of the past 30 years. While in 1980 the ratio of M2 to Shadow banking monetary aggregates was 135%, the resultant surge in shadow debt, and thus shadow money, as a result of 30 years of declining interest rates, led to a M2/Shadow ratio of under 50% in 2008 (black line in chart below).

A complete and valid representation of aggregate monetary velocity has to take all these excess components: anything else is an insult to the intelligence of one's, in this case, readers. Which is where a far more different picture than that presented by some pundit or another emerges.

Note that in the chart below, as credit has become easier to procure, and increasingly cheaper since the arrival of the Maestro, and as cheap credit-derived money flooded the system, the overall broad money velocity (M2 and Shadow Banking monetary equivalents) has collapsed, even as GDP has been growing. In other words, as more and more credit has gotten added to the system over the past three decades, such new credit has had a progressively smaller impact on true economic growth. And here is the key point that makes a mockery out of the abovementioned "analysis" - even as M2 has grown by under $300 billion, courtesy of QE 1 and QE Lite, shadow banking liabilities and appropriate aggregates have plunged by $2.1 trillion in just the first six months of 2010! Let's see: +$300 billion compared to -$2.1 trillion. Hmmm.

Let's recall that the prevailing theme of the ongoing depression is deleveraging: at the consumer and at the corporate level (courtesy of sovereign leveraging, and $13.7 trillion in federal debt compared to under $9 trillion three years ago, which makes the cost of deleveraging next to nothing), the current collapse in Shadow liabilities, and associated monetary aggregates will persist for a long, long time. Keep in mind the Fed has little control over this, and this is what most pundits (no matter how self-proclaimed) get teribly confused by. All that the Fed can do is hope to increase the velocity of the corresponding circulation of M2, and beyond, money.

Which is where things get really ugly.

Contrary to the beach pundit's conclusion that the growth in M2 most certainly portends a pick up in GDP, we present the completely opposite case: namely that the collapse of shadow credit, and the resultant elimination of shadow money, could result in a plunge in US GDP as high as $4.5 trillion over the next 3 years. And what most don't understand (but Blackhawk Ben most certainly does) is that what M2 does over this period is completely irrelevant as shadow deleveraing will be the far more dominant force vis-a-vis GDP.

And what the Fed is trying to do, more so than anything, is to return the M2+Shadow Banking velocity back to traditional levels, far higher from the current 58%. That the Fed has succeeded in raising it by 8% from its all time low 2 years ago, is purely a function of Quantitative Easing. The real question is whether QE2 will have the same success in stoking at least some consolidated velocity and its resultant GDP pick up.

影子銀行系統累積的金融風險

  影子銀行雖然是非銀行機構,但是又確實在發揮著事實上的銀行功能。它們為次級貸款者和市場富餘資金搭建了橋梁,成為次級貸款者融資的主要中間媒介。影子銀行通過在金融市場發行各種複雜的金融衍生產品,大規模地擴張其負債和資產業務。所有影子銀行相互作用,便形成了彼此之間具有信用和派生關係的影子銀行系統。

  影子銀行的基本特點可以歸納為以下三個。其一,交易模式採用批發形式,有別於商業銀行的零售模式。其二,進行不透明的場外交易。影子銀行的產品結構設計非常複雜,而且鮮有公開的、可以披露的信息。這些金融衍生品交易大都在櫃臺交易市場進行,信息披露制度很不完善。其三,杠桿率非常高。由於沒有商業銀行那樣豐厚的資本金,影子銀行大量利用財務杠桿舉債經營。

  在過去20年中,伴隨著美國經濟的不斷增長,人們對於信貸的需求與日俱增,美國的影子銀行也相應地迅猛發展,並與商業銀行一起成為金融體系中重要的參與主體。影子銀行的發展壯大,使得美國和全球金融體系的結構發生了根本性變化,傳統銀行體系的作用不斷下降。影子銀行比傳統銀行增長更加快速,並游離於現有的監管體系之外,同時也在最後貸款人的保護傘之外,累積了相當大的金融風險。

分析
  • 全球貨幣寬鬆程度過去只用 M1B、M2,自從影子銀行壯大後,影子銀行比傳統銀行增長更加快速,美國和全球金融體系的結構發生了根本性變化,全球貨幣供應需改成影子銀行創造之貨幣供應量+M2,所以全球貨幣寬鬆程度已經是由債延伸之商品在加速
  • 因此當美元升息時,垃圾債泡沫就易破滅,全球經濟隨時受影子銀行風險產生影響;
  • 中國不降低利率讓企業介由正常銀行體系借出資金同時促進內需消費,這情況對中國大陸反而更危險,因為一推企業借債製造『產能過剩泡沫』就如同地方房地產債一樣也是『過剩泡沫』現象中國大陸經濟問題是利率過高內需消費不足

2014年8月21日 星期四

從蘇格蘭獨立公投看全球國家組織及權利趨勢正在改變 ( From Scottish referendum on independence to see the global national organizations of the trend is changing )

蘇格蘭9月獨立公投 結果充滿未知數

蘇格蘭9月中旬將舉行獨立公投,決定是否脫離英國,最新民調顯示,目前支持獨立的蘇格蘭民眾比例約25%、反對者佔43%,另有29%民眾至今不願表態,使獨立公投結果仍充滿未知數。

這次的調查,蘇格蘭社會研究中心在5月至7月間進行,發現支持獨立的蘇格蘭民眾,相較2013年的調查結果,支持者從20%上升至25%,上升幅度相當小。

若強迫蘇格蘭人選擇,他們是蘇格蘭人、還是英國人,有65%民眾會選擇自稱蘇格蘭、僅23%願意說是英國人;然而,就算獨立,仍有68%民眾希望持續使用英鎊,只有14%傾向另設立新貨幣。

對於蘇格蘭有意脫離,多數的英國人表態反對,即使將權力下放,也希望蘇格蘭留下。按照民調結果,9月18日當天,將有將近8成的蘇格蘭人會到場投票。

蘇格蘭獨立運動 英國名人選邊站
J.K.羅琳定居英國蘇格蘭首都愛丁堡,6月投入約5千萬新台幣
反對獨立運動。

蘇格蘭獨立公投將於9月18日舉行,蘇格蘭及英格蘭出身的名人們紛紛對此議題表態,反對派名人甚至連署200人反對獨立,支持與反對兩方造成強烈地對立。

日本《每日新聞》報導,「007」電影中飾演詹姆士‧龐德的第一任演員史恩‧康納萊(Sean Connery)是支持獨立的蘇格蘭籍演員,電影中龐德是為英國政府效命的情報員,康納萊本人卻毫無疑問是蘇格蘭獨立的支持者,「獨立運動的重點在於蘇格蘭能夠積極地放眼未來,」康納萊用蘇格蘭口音的英文表達以蘇格蘭為榮的信念,「獨立是平等及民主價值的基礎。」

另一方面,反對派名人如滾石樂團的米克‧傑格(Mick Jagger)、大衛‧鮑伊(David Bowie)等200位人近日參與了反獨立運動連署。《哈利波特》的作者J.K.羅琳(J.K.Rowling)是英國西南部出身的英格蘭人,現定居在蘇格蘭首都愛丁堡,「獨立將使經濟面臨極大風險」。羅琳6月贊助了反獨立運動1百萬英鎊(約5千萬新台幣),表現出十足反對獨立的立場。

史恩‧康納萊身為第一代007,心中是徹底地支持蘇格蘭獨立派,認為獨立是蘇格蘭放眼未來的關鍵,
也是平等及民主價值的基礎。(資料照,法新社)
分析

  • 由蘇格蘭獨立公投、加拿大魁北克獨立公投、香港占中運動都不難看出全球國家組織及權利趨勢正在改變,國家組織及權利越有彈性,國家發展越能建全;
  • 以中國大陸民主程度落後及國家權利過於集中,不利於以後中國大陸國家發展,日後政治鬥爭仍會非常劇烈、各地民眾抗爭數量不會減少;
  • 中國大陸應該將國家組織重新思考成市、省、聯邦自治區、協國邦聯、區域性邦聯來運作,逐漸開放部份民主程序降低馬列思想轉為社會福利思想,讓大亞洲區域性體制形成,促進亞洲和平與經濟繁榮,也形成歐、美、亞三大經濟區域,人民幣國際也能穩定加速成長,更讓海外華人深感榮耀,中國大陸政治制度、國家組織彈性及民主制度才能超越過去歷代極權思維陷井裡;( 註:過去中國政治制度一直是極權體制,結果就是幾百年一次大戰爭改朝換代,幾乎占人類戰爭數量最高區域,數個朝代被外族統治,中國政治極權體制對全華人沒什麼好處!)